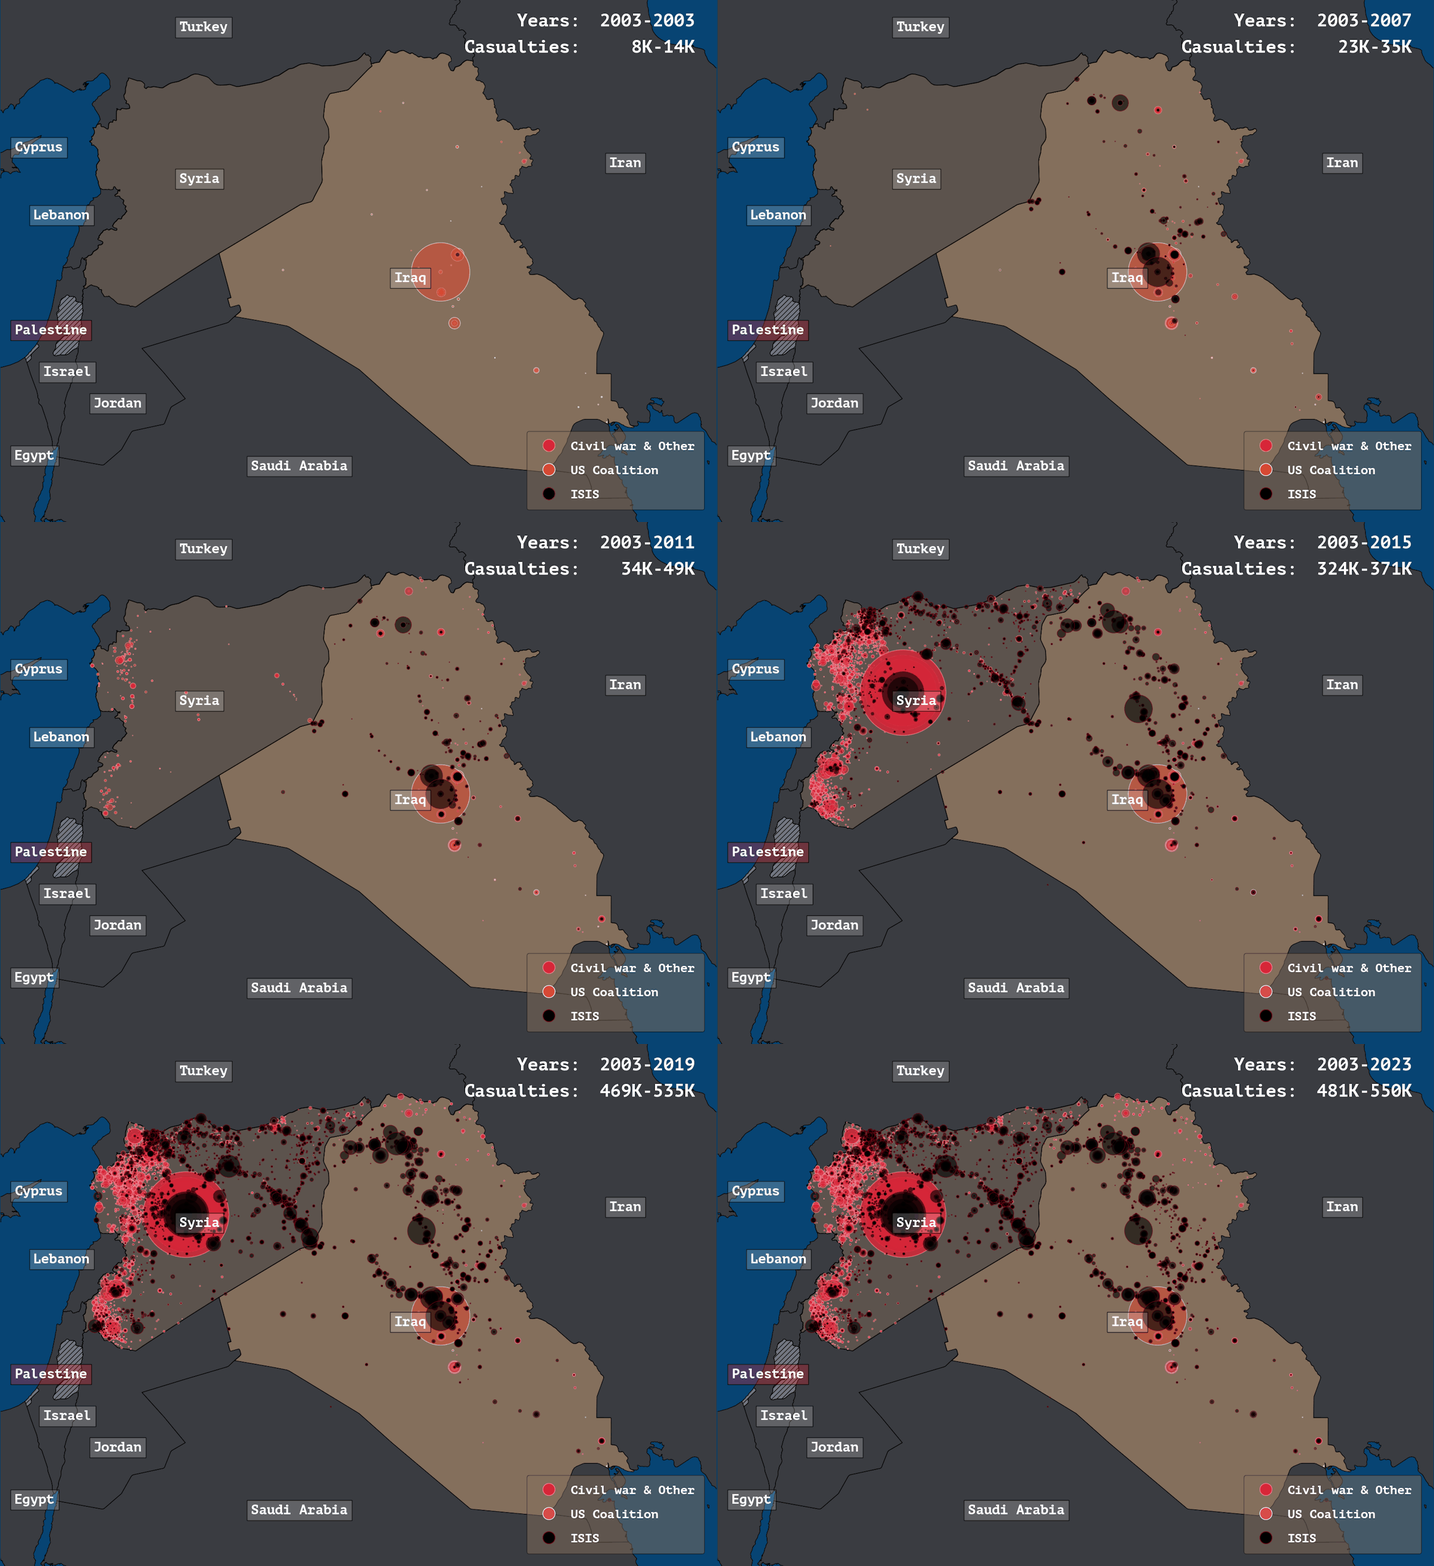
Visualizing The wars in Syria and Iraq, Civil War, and the Spread of ISIS
by u/oscarleo0
Data Source: https://ucdp.uu.se/
Full article with more areas: https://medium.com/datadriveninvestor/data-visualization-mapping-fatal-conflicts-and-events-between-1989-and-2023-ceee74dc4e9f
Tools used: Python, Matplotlib, Seaborn, Geopandas
This dataset (UCDP) contains events of organized violence between
1989 and 2023. In this visualization, I’ve plotted all events from Iraq
and Syria since 2003. The number of casualties are estimated and not
necessarily accurate.
The black circles are events where ISIS is participating in the armed conflict without allies.
The red circles are mostly the Syrian government against Syrian insurgents but can also include extremist violence.
The size of the circles are decided by the number of casualties linearly.

