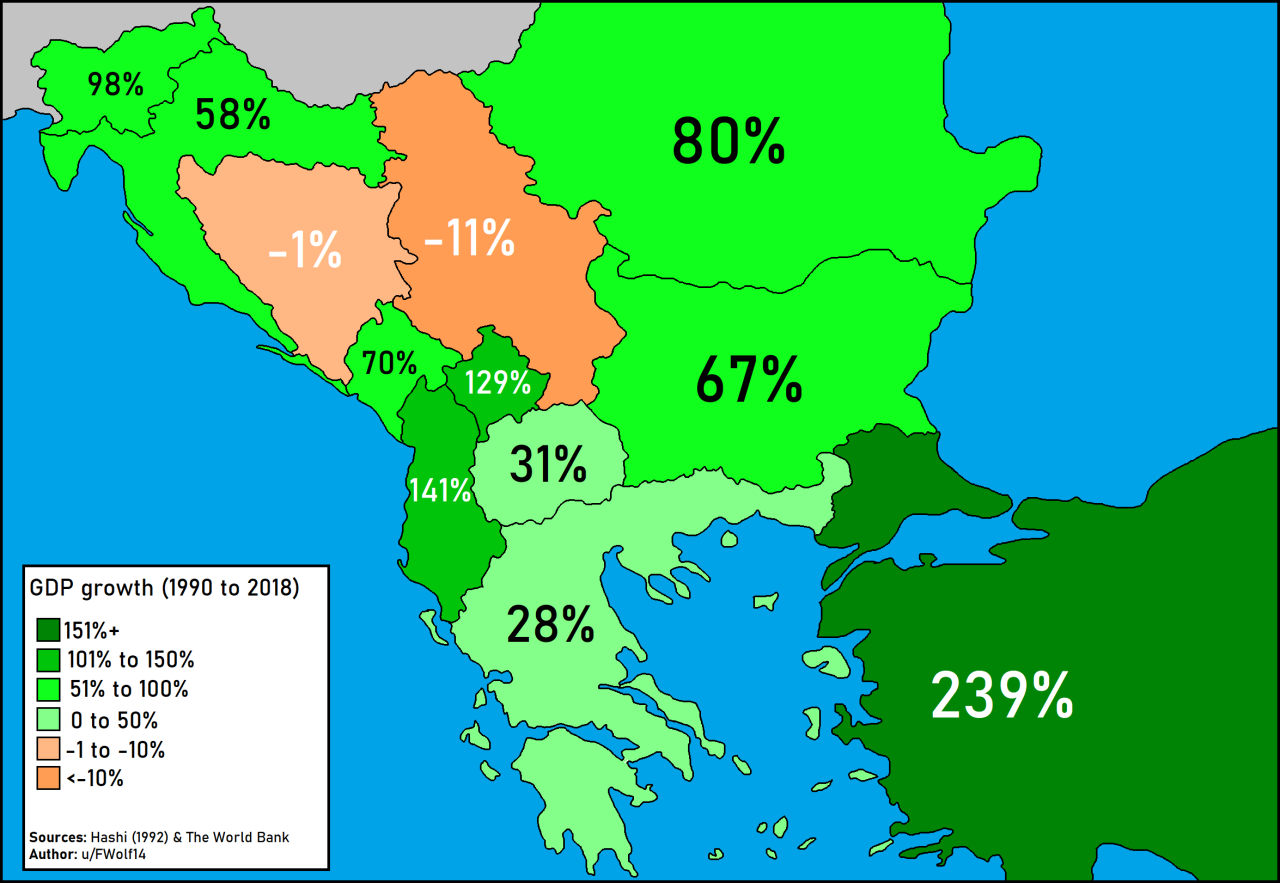

Total GDP Growth in Balkan Between 1990 and 2018.
by FWolf14
Methodological Notes:
The World Bank only reports data for Albania, Turkey, Greece, Romania, Bulgaria, Slovenia and North Macedonia. Data for Kosovo, Serbia, Montenegro, Bosnia and Hercegovina, and Croatia was generated by using the relative share of income within Yugoslavia with the GDP of North Macedonia and Slovenia serving as inputs.
Raw Data:
Country – GDP in 1990 (Billion Constant 2010 USD) – GDP in 2018 (Billion Constant 2010 USD)
- Greece – 197.552 – 252.723
- Slovenia – 27.944 – 55.321
- Croatia – 41.115 – 64.900
- Serbia – 54.065 – 48.040
- Turkey – 365.299 – 1236.994
- Romania – 124.804 – 224.629
- Montenegro – 3.017 – 5.120
- Bosnia and Herzegovina – 20.407 – 20.131
- North Macedonia – 8.590 – 11.236
- Bulgaria – 36.293 – 60.767
- Albania – 6.043 – 14.548
- Kosovo – 3.380 – 7.739