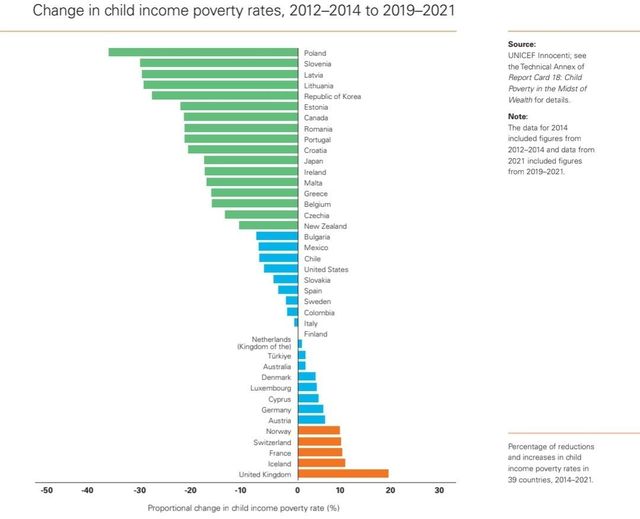
Chart shows recent changes in Child Income Poverty Rates (in %) across 39 selected countries. I am very disappointed to see things have gotten slightly worse in Australia. That said, lots of big economies have seen children worse off in the last years. HT @EconomyInformal